BENGALURU: As people across most of the globe retreated indoors under the lockdown announced by most of the countries to reduce the growth rate of Covid2019, world economies were badly hit. Officegoers had no other option but to use media to keep themselves occupied as the amount of work-to-do shrank. With the closure of education institutions, theaters and malls and hotels, etc., misplaced suspicion about the safety of newsprint, no new television/film content being produced, news and movies on television, OTT, internet, social media, became the new tools for entertainment and information, for networking and socialising distantly, education, occupying minds, etc.
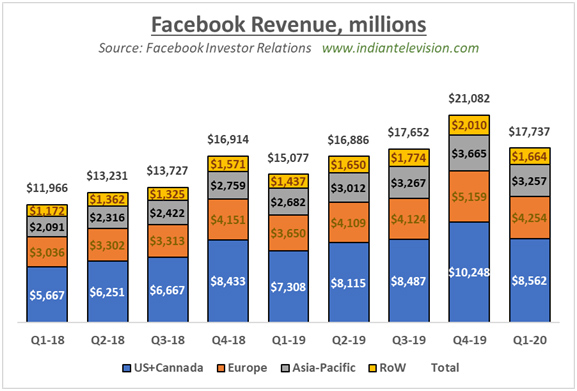
Social media networking major Facebook or FB reported its numbers for the first quarter ended 31 March 2020 (Q1 2020, quarter or period under review). Facebook reported 15.87 per cent lower Q-o-Q numbers for the quarter under review as compared to the previous quarter (quarter ended 31 December 2019, Q4 2019), but 17.64 per cent higher Y-o-Y than the year ago quarter Q1 2019. FB has witnessed Q-o-Q revenue declines in the first quarter earlier – in Q1 2018, revenue declined 7.76 per cent as compared to Q4 2018 and in Q1 2019 it declined 10.86 per cent as compared to Q4 2018. Overall, Facebook numbers have shown an increasing trend, the Covid2019 quarter is just a slightly bigger than the normal bump in its path to growth.
FB reports revenues from four major geographical regions in the world – the largest in terms of revenue being the US-Canada region, followed by Europe, Asia-Pacific (A-Pac) and the Rest of the World or RoW. The US-Canada region contributes about 48 per cent, the Europe region about 24 per cent, APAC region about 18 per cent and RoW about 10 per cent to FB’s revenues. Please refer to the figure below for FB revenue breakup.

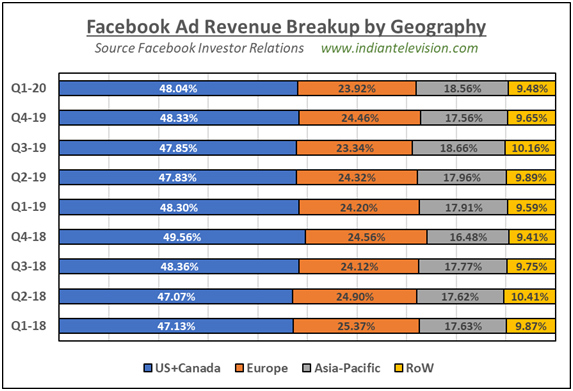
Advertisement is the major revenue stream for FB that contributes to more than 98 per cent to its overall revenues. The figure below shows contribution in terms of percentage of ad revenue to total ad revenue from these geographical regions. As is obvious, the APAC region is the only one that has shown growth in contribution to FB’s ad revenues during Q1 2020 – It contributed 17.56 per cent to FB’s ad revenues in the previous quarter and its contribution to ad revenue increased to 18.56 per cent in Q1 2020. As a matter of fact, the APAC region has shown only two downward blips in its contribution to ad revenue during 9 quarters (the quarter under review and its preceding 8 quarters). These two blips happened in Q1 2020 and Q4 2018.
Growth in contribution to revenue from the APAC region has generally been steadier than the other regions. When FB’s revenues have declined Q-o-Q, the decline in revenues from the APACregion has been lower than the other regions during these nine quarters. The APACregion’s total revenue declined 11.13 per cent Q-o-Q in Q1 2020 as compared to declines of 16.45 percent, 17.54 per cent and 17.21 per cent from US-Canada, Europe and RoW regions respectively. Y-o-Y, revenues grew 17.16 percent, 16.55 percent, 21.44 per cent and 15.80 per cent in Q1 2020 from FB’s US-Canada, Europe, APAC and RoW regions, respectively.

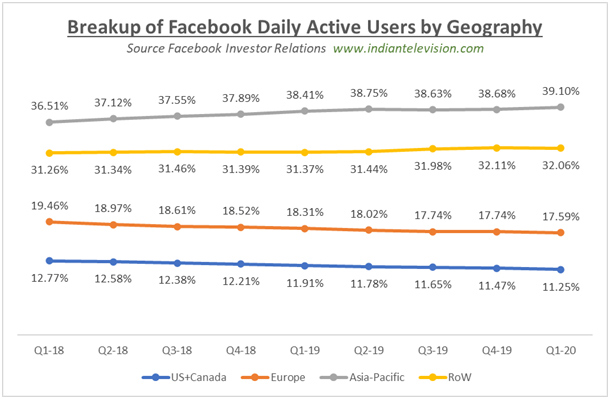
Facebook’s Daily Active Users or DAU grew 4.65 per cent in Q1 2020 to 1.734 billion as compared to 1.657 billion in Q4 2019. The APAC region has a major chunk of humanity, consequently, the company’s largest DAU are from the APACregion, and the number of these APACusers in Q1 2020 has grown 5.77 per cent Q-o-Q. Comparatively, the US-Canada, Europe and RoW regions have seen DAU growth in the quarter under review versus the immediate trailing quarter of 2.63 percent, 3.74 per cent and 4.51 per cent respectively. Please refer to the figure below:

The US-Canada region has the least DAU among the four FB regions, however, this region has FB’s highest ARPU or average revenue per person, as well as the highest Family Average Revenue Per Peson or ARPP. Facebook defines a monthly active person (MAP) as a registered and logged-in user of Facebook, Instagram, Messenger, and/or WhatsApp (collectively, FB’s "Family" of products) who visited at least one of
these Family products through a mobile device application or using a web or mobile browser in the last 30 days as of the date of measurement.
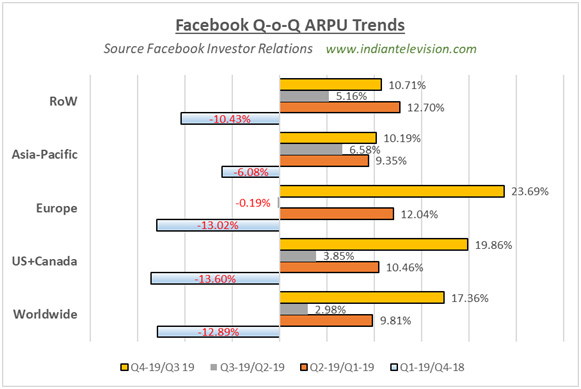
With drop in revenue, Facebook’s ARPU in Q1 2020 dropped 12.89 per cent Q-o-Q world wide. Q-o-Q FB’s APAC region ARPU declined 6.08 percent. ARPU drops of 13.6 per cent by US-Canada, 13.02 per cent by Europe and 10.43 per cent by RoW also happened in the quarter under review. Please refer to the figure below:

Excerpts on what the company has to say
"Our work has always been about helping you stay connected with the people you care about," said FB founder and CEO Mark Zuckerberg, "With people relying on our services more than ever, we're focused on keeping people safe, informed and connected."
Impact of Covid2019 on Outlook
On Revenue: Our business has been impacted by the Covid2019 pandemic and, like all companies, we are facing a period of unprecedented uncertainty in our business outlook. We expect our business performance will be impacted by issues beyond our control, including the duration and efficacy of shelter-in-place orders, the effectiveness of economic stimuli around the world, and the fluctuations of currencies relative to the U.S. dollar.
After the initial steep decrease in advertising revenue in March, we have seen signs of stability reflected in the first three weeks of April, where advertising revenue has been approximately flat compared to the same period a year ago, down from the 17 per cent year-over-year growth in the first quarter of 2020. The April trends reflect weakness across all of our user geographies as most of our major countries have had some sort of shelter-in-place guidelines in effect.
On Expenses:We expect to realize operational expense savings in certain areas such as travel, events, and marketing as well as from slower headcount growth in our business functions. However, we plan to continue to invest in product development and to recruit technical talent. In addition, we have committed over $300 million to date in investments to help our broader community during the crisis, which will have an impact on our financial performance this year. As a result, we expect total expenses in 2020 to be between $52-56 billion, down from the prior range of $54-59 billion. While this reflects a moderate reduction in the planned growth rate of total expenses, our overall expense growth in the face of expected revenue weakness will have a negative impact on 2020 operating margins.
On Capex: Our significant investments in infrastructure over the past four years have served us well during this period of high user engagement. We plan to continue to grow our capex investments to enhance and expand our global infrastructure footprint over the long term. In 2020, we expect capital expenditures to be approximately $14-16 billion, down from the prior range of $17-19 billion. This reduction reflects a significant decrease in our construction efforts globally related to shelter-in-place orders. Given the strong engagement growth and related demands on our infrastructure, this year's capex reduction should be viewed as a deferral into 2021 rather than savings.


